LABOR DAY WEEK – UPDATE ON COVID-19
Pennsylvania’s COVID-19 positivity rate for the period of Aug. 28 through Sept. 3 had increased to 4 percent, compared to 3.2 percent for the 7-day period a week earlier.
That rate is still below the 5-percent threshold which state officials say represents a concerning level of virus transmission, but was a significant jump in one week, after several weeks of gradual decline.
The DoH noted increases due to outbreaks in Allegheny, Philadelphia and York counties. Given the data released by the department, restaurants and bars don’t seem to be the primary source of virus transmission, nor does the crackdown on them appear to be having the desired effect.
Going into the Labor Day weekend, the DoH had indicated an increasing number of new virus cases may be due to mass gatherings, based on contact tracing data. And with schools and colleges reopening, additional testing is being conducted and students are congregating. But the inability or refusal of the Department to release specifics makes it virtually impossible to assign cause.
That said, as of midnight on Labor Day, there were 547 additional positive cases of COVID-19, bringing the statewide total to 139,863. Approximately 9,901 of Pennsylvania’s total cases are among health care workers.
The number of tests administered within the last 7 days between August 31 and September 6 was 161,316 with 5,838 positive cases. There were 16,494 test results reported to the department through 10 p.m., September 6.
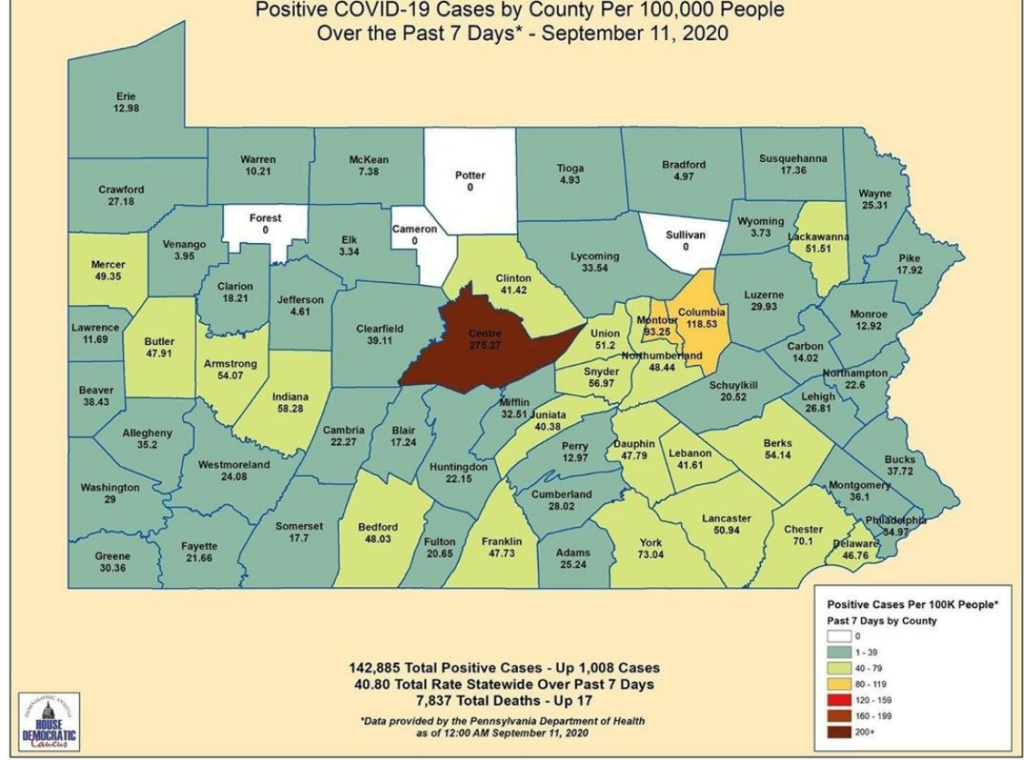
Pennsylvania’s total deaths attributed to COVID-19 now total 7,780, an overnight increase of 20. County-specific information and a statewide map are available on the COVID-19 Data Dashboard.
Beginning August 29, the department began publishing COVID-19 case counts using the updated standardized case definition for COVID-19 from the Council of State and Territorial Epidemiologists. This revised case definition updates criteria for case identification and case classification based on the continued evolution of the COVID-19 pandemic. It updates probable case classifications and adds suspect case classifications. The definition for confirmed cases using a positive PCR test has not changed. Viral antigen tests, which identify people who are likely currently infected, will now be considered a probable case, even if the individual has no symptoms or exposure history. Persons with a positive antibody (serology) test, moving forward, will no longer be considered a probable case. However, cases previously counted as probable cases, using the prior national case definition, will remain counted as probable cases.
There are 71 cases who had a positive viral antigen test and are considered probable cases and 646 patients who have a positive serology test and either COVID-19 symptoms or a high-risk exposure.
At least 1,608,378 patients had tested negative by Labor Day. Of the patients who have tested positive to date the age breakdown is as follows:
- Approximately 1% are ages 0-4;
- Nearly 2% are ages 5-12;
- Approximately 4% are ages 13-18;
- Nearly 11% are ages 19-24;
- Approximately 37% are ages 25-49;
- Approximately 22% are ages 50-64; and
- Nearly 23% are ages 65 or older.
Most of the patients hospitalized are ages 65 or older, and most of the deaths have occurred in patients 65 or older. More data is available here.
The department is seeing significant increases in the number of COVID-19 cases among younger age groups, particularly 19 to 24-year-olds. The following regions saw significant increases among 19 to 24-year-olds in each month from April to August 31:
- NC – Approximately 7 percent of cases in April to approximately 26 percent of cases in August;
- SE – Nearly 5 percent of cases in April to nearly 17 percent of cases in August;
- NE – 6 percent of cases in April to nearly 20 percent of cases in August;
- SW – Approximately 5 percent of cases in April to 13 percent of cases in August;
- SC – Approximately 7 percent of cases in April to nearly 14 percent of cases in August; and
- NW – Nearly 7 percent of cases in April to approximately 11 percent of cases in August.
In nursing and personal care homes, there are 21,430 resident cases of COVID-19, and 4,613 cases among employees, for a total of 26,043 at 947 distinct facilities in 61 counties. Out of the state’s total, 5,240 deaths – 67.3% - occurred in residents from nursing or personal care facilities. A county breakdown can be found here.
The latest information for individuals and businesses, is online “Responding to COVID-19” on pa.gov.